A data rich environment:
They tell me that military euphemism for torrents of bullets and shells coming from all directions is, “A target rich environment.” It is not a good place to be, opportune or not.
Google has been helpful enough to provide an environment that has similar amounts of data available. It’s a lot more pleasant. It is called Gapminder. I would encourage you to go to http://www.gapminder.org/ and then click on “Load Gapminder World.” Once the system has finished cracking its knuckles, you will be looking at a six dimensional graph. There are circles that represent countries. The size of the circle is the size of the country. The color of the circle is the region of the country. There is a vertical axis that starts out reading “Life Expectance (Years).” There is a horizontal axis that starts out as “Income per person….” The sixth dimension is accessed by dragging a slider along at the bottom. Somebody has done a lot of work.
Go there and click on the horizontal axis to get a menu. At the top of the menu is total fertility. Click on that. Now go to the vertical axis and click on it. Find “population” on the menu close to the bottom. At the bottom of the new menu is “Age at first marriage (women).” Click that. After some more cyber knuckle abuse click on the “play” button. It winds up looking like this.
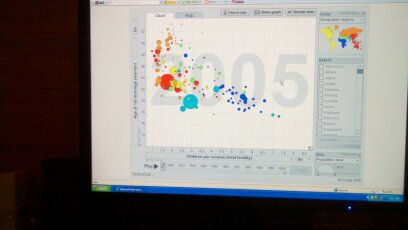
http://www.gapminder.org/world/#$majorMode=chart$is;shi=t;ly=2003;lb=f;il=t;fs=11;al=30;stl=t;st=t;nsl=t;se=t$wst;tts=C$ts;sp=5.99741935483872;ti=2005$zpv;v=0$inc_x;mmid=XCOORDS;iid=phAwcNAVuyj0TAlJeCEzcGQ;by=ind$inc_y;mmid=YCOORDS;iid=t4eF8H%5Fjq%5FxyKCUHAX6VT1g;by=ind$inc_s;uniValue=8.21;iid=phAwcNAVuyj0XOoBL%5Fn5tAQ;by=ind$inc_c;uniValue=255;gid=CATID0;by=grp$map_x;scale=lin;dataMin=0.855;dataMax=8.7$map_y;scale=lin;dataMin=13;dataMax=34$map_s;sma=49;smi=2.65$cd;bd=0$inds= downloaded December 13, 2010.
Except yours will be legible. I find it helpful to click on the button just above the right side of the graph. If you play around with it some you will find that a lot of things track with income per person. Fertility and income have a reciprocal relationship. As income rises, fertility falls because of course people have more choice of mate if they can travel around. As fertility falls, income rises because a higher percentage are working. At least that has been true so far. That will change. I mentioned a few days ago that either one can happen first.
What you see even with the cramped view I offer is that there is a horizontal band in which age at first marriage is about the same over a range of fertility and a vertical band in which age at first marriage varies quite a lot under conditions of low fertility. The pattern you will see as you play through the years is that there is some variation but recently there is a strong tendency for fertility to fall to a certain level and then marriage age rises.
So it is not true that birth rate is low because people marry later. The fall in fertility comes first.
This is a surprise to me. It appears that infertility has two mechanism. Obviously there is a limit to how high age at marriage can rise without a further fall in fertility but we do not see it yet.
You can select one or more countries from the list to the right of the graph and the graph will track those countries.
My heartiest congratulations go to the folks at Google. I would never have imagined that six dimensions could be represented at once. Of course it’s rather depressing. As you will see, Germany now has an average age at first marriage of 30 and rising rapidly. At that rate, the girls who have just been born will not get married until forty. In other words they will have about zero interest in having children at all. Other rich countries include immigrants in their statistics, so Germany is probably a pretty good representation of countries that are currently rich.
I knew this was going on, but I really didn’t suspect how far it had gone, how fast it was moving nor that it was accelerating. I think more people need to take an interest.
My next summary will be posted here on December 24.
There have been 8,053 visitors so far.
Home page.